


Up here in Alberta, Canada, we have the 3rd highest infection rate in Canada of all the provinces. Calgary where I live has approx. 75% of all the provinces cases. The biggest contributors were a church group early on, then seniors homes (one in Calgary as about 30% of all deaths in province). Now we have 2 new large clusters just outside the city at 2 beef packing plants. These have been particularly bad due to close working quarters in the industry, many people car sharing due to low pay, and many are from large households shared by multiple families and family members. They in turn work in many other low paid industries (grocery stores, seniors centers). The areas went from a very low background quantity to over 550 in a matter of days.
Seniors homes are so badly hit as many of the workers worked in multiple homes to make a wage. Most seniors home pay very low wages and only part time work so they don't have to pay benefits.
The other issue we have not got clarity on is that Alberta has by far the largest rate of testing (at last count 2nd in the world). So do we have a much higher rate or are we just seeing a more 'true' rate.
We look like we may be turning a corner, but it would make more sense to see what the picture looks like across the province and if there are major clusters, quarantine those areas and let the rest be considered to go back to their lives with some rules for distancing in place.
Hope everyone is staying safe and well,
Neil.
Coronavirus Thread
Forum rules
Disallowed: religion, race, politics, war and disrespect toward others.
Allowed: history, science(!), computers, sports, movies, careers, art, music, relationships and the ten million other topics in our lives.
Disallowed: religion, race, politics, war and disrespect toward others.
Allowed: history, science(!), computers, sports, movies, careers, art, music, relationships and the ten million other topics in our lives.
-
scot850
- Posts: 14870
- Joined: 5 April 2010
- Year and Model: 2000 V70 R
- Location: Calgary, Alberta, Canada
- Has thanked: 1836 times
- Been thanked: 1709 times
Re: Coronavirus Thread
2006 V70 2.5T AWD Polestar tune
2000 V70 R - still being an endless PITA
2006 XC70 - Our son now has this and still parked in our garage
2003 Toyota 4Runner V8 Limited
2015 Kia Sportage EX-L - Sold
1993 850 GLT -Sold
1998 V70 XC - Sold
1997 Volvo 850 SE NA - Went to niece in California - Sold
2000 V70 SE NA - Sold
2000 V70 R - still being an endless PITA
2006 XC70 - Our son now has this and still parked in our garage
2003 Toyota 4Runner V8 Limited
2015 Kia Sportage EX-L - Sold
1993 850 GLT -Sold
1998 V70 XC - Sold
1997 Volvo 850 SE NA - Went to niece in California - Sold
2000 V70 SE NA - Sold
-
Phainein7
- Posts: 120
- Joined: 22 December 2019
- Year and Model: 1993 940
- Location: East of Rockies
- Has thanked: 1 time
- Been thanked: 6 times
When these Mortality Analyses are examined, there is a wide variation in positive cases vs deaths. Some of these differences are related to a given location, medical resources, social habits, living conditions, medium age of population, etc. But, these stats are based upon positive cases vs deaths...not antibody tests.
As you may know, "Apr 27, 2020: Of Alberta's 4,850 cases, 3,366 are in the Calgary zone."
Without highly accurate antibody tests, those mortality stats are skewed higher. In US in earlier days, only those who had the "classic" symptoms were allowed to take a covid-19 test, but some 70% do not experience a fever, which excluded them from a getting a test. Earlier antibody tests were a joke. Currently, I'm only aware of one test that claims to be 99% accurate, made by Siemens Healthineers, but it may be available by late May.
Of course, it is known that most people are not affected greatly, but seniors, and those with specific medical conditions, are affected the most. On another note, medical community has been on a learning curve, so fewer deaths are possible; and there appears to be a drug like remdesivir, which may be one treatment option, and this would reduce deaths.
Thus, when antibody testing rolls out, the mortality stats will show a lower death rate. But, I suspect it will be higher than flu rates. Covid-19 is much more aggresive than traditional flu

-
volvolugnut

- Posts: 6225
- Joined: 19 January 2014
- Year and Model: 2001 V70
- Location: Oklahoma USA
- Has thanked: 927 times
- Been thanked: 1000 times
State growth rates for April 28, 2020. All information is based on reported information and actual results may be different.volvolugnut wrote: ↑28 Apr 2020, 08:08 More statistics on US states and COVID-19 growth rates. My raw information is from Worldometer. Any errors or misrepresentations are my own.
These tables show all available US states and territories and the COVID-19 data for the last 5 days. I have sorted the states alphabetically and added growth rates for last several days for all states with ranking of each day. Of course, this information changes daily. I have presented the table in two parts because of the screen shot, but it is actually one table in Excel.
Again, results change daily.
For your information, the top 5 states or territories yesterday in growth rate (the worst containment) are: Minnesota (0.216) with 4181 cases, Guam (0.182) with 144 cases, Oklahoma (0.142) with 3410 cases, Iowa (0.137) with 6376 cases, and Delaware (0.136) with 3577 cases. Guam growth rate is not of concern, because of their very low number of cases. Minnesota had an increase two days in a row. Most states mentioned recently had flat or declining growth rates yesterday. A new column added on the left today shows the current growth rate divided by the 5 day moving average. Yesterday, Alaska and Guam had numbers over 2.0.
My calculated growth rate for USA is 0.0312 for yesterday, up from previous day of 0.0285. This is not population or case number weighted.
We are in a critical time now as some states start to loosen restrictions. Continue to do your part to stay healthy and keep virus spread down.
Stay safe out there. Keep your family close and others at a distance.
volvolugnut
- Attachments
-
- State Growth 042820 B.JPG (204.45 KiB) Viewed 688 times
-
- State Growth 042820 A.JPG (243.45 KiB) Viewed 688 times
The Fleet:
Volvo: 2001 V70 T5, 1986 244DL, 1983 245DL, 1975 245DL, 1959 PV544, multiple Volvo parts cars.
Mercedes: 2001 E320, 1973 280, 1974 280C, 1989 300E, 1988 300TE, 1979 300TD, parts cars.
2009 Smart Passion
Ford: 1977 F350, 1964 F150 (2), 1938 Tudor Sedan
Farmall tractors: 1956 400 Diesel, 1946 A
And others.
-
volvolugnut
- Posts: 6225
- Joined: 19 January 2014
- Year and Model: 2001 V70
- Location: Oklahoma USA
- Has thanked: 927 times
- Been thanked: 1000 times
The Unacast website indicates the information is gathered from cell phone locations. I also have doubts about the correlation of cell phone locations to spread of the virus.Phainein7 wrote: ↑28 Apr 2020, 19:00
Quick assessment for one state....not relevant. State has 55 clusters of infections (nursing homes, hospitals, religious gatherings, meat packing plants and Correctional Facility). For instance, Correctional Facility has 65 inmates and 71 prison employees testing positive. And that county gets a "D" grade. Where I live, a grade B is given, but its most likely based upon the only 2 cases todate, where first person (senior: deceased) took a trip to Oklahoma, brought back covid-19, and then infected a co-worker (out of ICU and home) when they took a pickup ride for several hours on a business trip.
=====================
volvolugnut
The Fleet:
Volvo: 2001 V70 T5, 1986 244DL, 1983 245DL, 1975 245DL, 1959 PV544, multiple Volvo parts cars.
Mercedes: 2001 E320, 1973 280, 1974 280C, 1989 300E, 1988 300TE, 1979 300TD, parts cars.
2009 Smart Passion
Ford: 1977 F350, 1964 F150 (2), 1938 Tudor Sedan
Farmall tractors: 1956 400 Diesel, 1946 A
And others.
Volvo: 2001 V70 T5, 1986 244DL, 1983 245DL, 1975 245DL, 1959 PV544, multiple Volvo parts cars.
Mercedes: 2001 E320, 1973 280, 1974 280C, 1989 300E, 1988 300TE, 1979 300TD, parts cars.
2009 Smart Passion
Ford: 1977 F350, 1964 F150 (2), 1938 Tudor Sedan
Farmall tractors: 1956 400 Diesel, 1946 A
And others.
-
Phainein7
- Posts: 120
- Joined: 22 December 2019
- Year and Model: 1993 940
- Location: East of Rockies
- Has thanked: 1 time
- Been thanked: 6 times
County is locked down...most business doors are closed to public, but if you need something, you call, and they deliver at their door, outside of building. Farmers/Ranchers are out and about, and since this is mostly agriculture area, few people are laid off.volvolugnut wrote: ↑29 Apr 2020, 10:18The Unacast website indicates the information is gathered from cell phone locations.
..
..===========
Gilead's coronavirus treatment remdesivir just succeeded in a crucial
study, raising hopes for a first COVID-19 drug
-
Phainein7
- Posts: 120
- Joined: 22 December 2019
- Year and Model: 1993 940
- Location: East of Rockies
- Has thanked: 1 time
- Been thanked: 6 times
Just tidbits...not directly related...HCoV-229E is another coronavirus.
Herd Immunity
"Volunteers experimentally inoculated with HCoV-229E showed a steep
decline in antibody response over time, and the majority could be
successfully reinfected a year later. Patients infected with SARS-CoV
also showed a decline in antibody titers over time. On the animal
side, cattle infected with bovine coronavirus (BCoV) — the ancestor of
at least one human coronavirus — are susceptible to reinfection and
show no long-term immunity."[1]
"HCoV-229E is a common non-SARS HCoV, with about 90 % of adults having
detectable antibodies (Severance et al., 2008). [2]
Note - Question here is if a previous infection with a human coronavirus may assist those with covid-19. So far, I can't nail this down
Pickup Truck - Don't ride around in one for 3 hours with an infected person, or one might end up in ICU, as one person I'm aware of did.
"Many health care workers have become seriously ill with COVID-19,
despite being young and healthy. Various reports have suggested it’s
because they were exposed to more virus than a typical COVID-19
patient. This is consistent with experimental studies of porcine
respiratory coronavirus (PRCV). Scientists found pigs that were
inoculated with it developed more severe cases than the pigs that
caught the disease naturally. This makes logical sense, since the
higher the amount of virus infecting you, the harder it is for your
body to control its replication and spread."[1]
Note - First cite is readable, but second cite is too technical
Cite 1
Cite 2
-
Phainein7
- Posts: 120
- Joined: 22 December 2019
- Year and Model: 1993 940
- Location: East of Rockies
- Has thanked: 1 time
- Been thanked: 6 times
Florida medical examiners were releasing coronavirus death data. The state made them stop.
When the medical examiners’ list was available, it showed more deaths than the state’s count.
https://www.tampabay.com/news/health/20 ... them-stop/
Note "A spokesperson for the health department’s Hillsborough County office said a lag in reporting accounts for some of the difference. The health department is also excluding some snowbirds and other seasonal residents, along with visitors who died in Florida, from its count. The medical examiners are including anyone who died in Florida."
State I'm in does not count out-of-state folks in a county when they test positive....I suspect more than one state is low-balling the death stats.
-
volvolugnut
- Posts: 6225
- Joined: 19 January 2014
- Year and Model: 2001 V70
- Location: Oklahoma USA
- Has thanked: 927 times
- Been thanked: 1000 times
State growth rates for April 29, 2020. All information is based on reported information and actual results may be different.volvolugnut wrote: ↑29 Apr 2020, 10:06 More statistics on US states and COVID-19 growth rates. My raw information is from Worldometer. Any errors or misrepresentations are my own.
These tables show all available US states and territories and the COVID-19 data for the last 5 days. I have sorted the states alphabetically and added growth rates for last several days for all states with ranking of each day. Of course, this information changes daily. I have presented the table in two parts because of the screen shot, but it is actually one table in Excel.
Again, results change daily.
For your information, the top 5 states or territories yesterday in growth rate (the worst containment) are: US Virgin Islands (0.75) with 62 cases, Minnesota (0.235) with 4644 cases, Nebraska (0.124) with 3784 cases, Iowa (0.115) with 6843 cases, and New Mexico (0.111) with 3213 cases. US Virgin Islands growth rate is not of concern, because of their very low number of cases. Minnesota had an increase three days in a row. New Mexico had an increase four days in a row. A new column added on the left today shows the current growth rate divided by the 5 day moving average. No states yesterday over 2.00.
My calculated growth rate for USA is 0.0341 for yesterday, up from previous day of 0.0312. This is not population or case number weighted.
We are in a critical time now as some states start to loosen restrictions. Continue to do your part to stay healthy and keep virus spread down.
Stay safe out there. Keep your family close and others at a distance.
volvolugnut
- Attachments
-
- State Growth 042920 B.JPG (207.38 KiB) Viewed 629 times
-
- State Growth 042920 A.JPG (245.34 KiB) Viewed 629 times
The Fleet:
Volvo: 2001 V70 T5, 1986 244DL, 1983 245DL, 1975 245DL, 1959 PV544, multiple Volvo parts cars.
Mercedes: 2001 E320, 1973 280, 1974 280C, 1989 300E, 1988 300TE, 1979 300TD, parts cars.
2009 Smart Passion
Ford: 1977 F350, 1964 F150 (2), 1938 Tudor Sedan
Farmall tractors: 1956 400 Diesel, 1946 A
And others.
Volvo: 2001 V70 T5, 1986 244DL, 1983 245DL, 1975 245DL, 1959 PV544, multiple Volvo parts cars.
Mercedes: 2001 E320, 1973 280, 1974 280C, 1989 300E, 1988 300TE, 1979 300TD, parts cars.
2009 Smart Passion
Ford: 1977 F350, 1964 F150 (2), 1938 Tudor Sedan
Farmall tractors: 1956 400 Diesel, 1946 A
And others.
-
Phainein7
- Posts: 120
- Joined: 22 December 2019
- Year and Model: 1993 940
- Location: East of Rockies
- Has thanked: 1 time
- Been thanked: 6 times
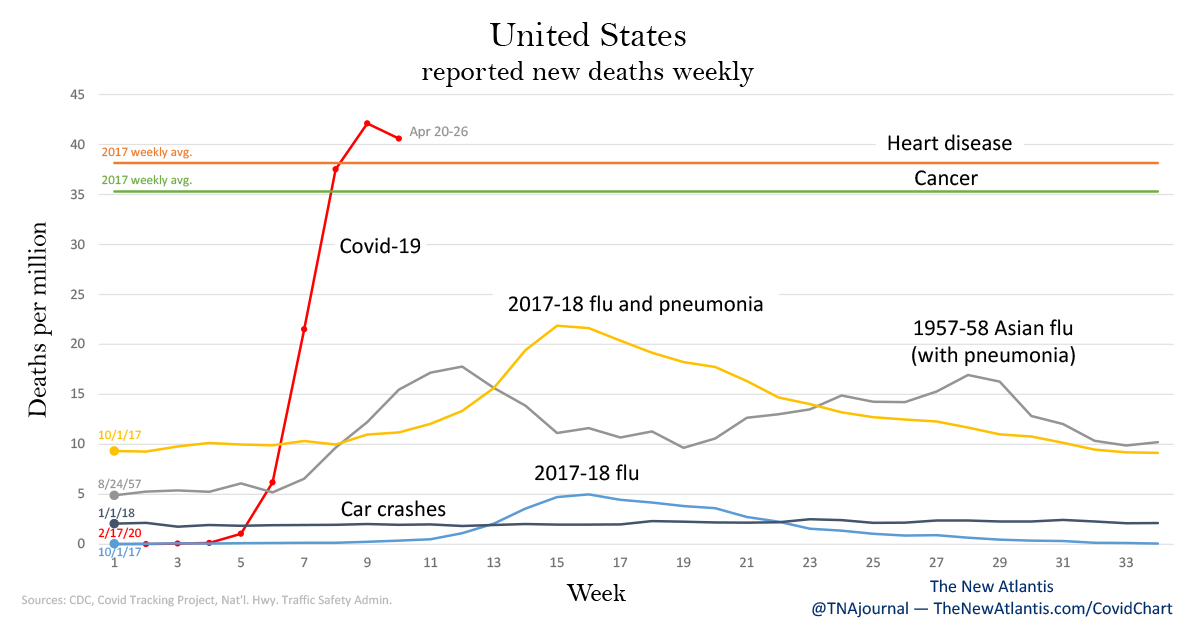
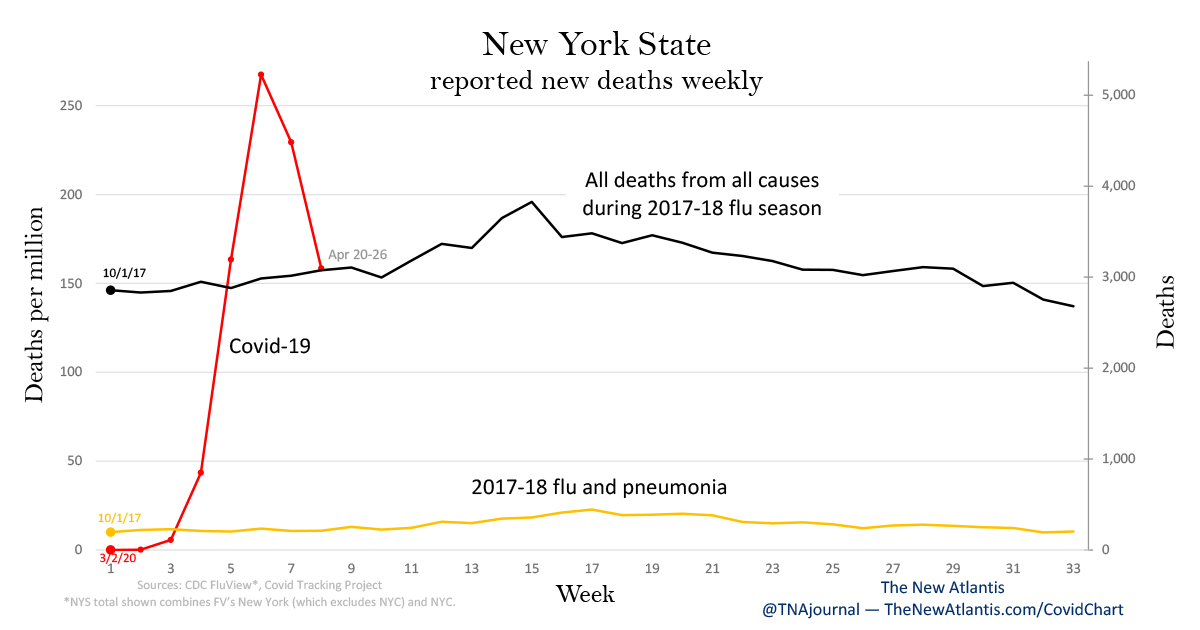
Not Like the Flu, Not Like Car Crashes, Not Like...
It’s about the spike.
How deadly is Covid-19 compared to seasonal flu, past pandemics, or car crashes?
To offer context, we have produced two charts showing coronavirus deaths along with deaths from other common causes in the past to which the disease has recently been compared. One chart shows deaths for the United States, the other for New York, the state hardest hit
.
.
.
-
volvolugnut
- Posts: 6225
- Joined: 19 January 2014
- Year and Model: 2001 V70
- Location: Oklahoma USA
- Has thanked: 927 times
- Been thanked: 1000 times
State growth rates for April 30, 2020. All information is based on reported information and actual results may be different.volvolugnut wrote: ↑30 Apr 2020, 07:57 More statistics on US states and COVID-19 growth rates. My raw information is from Worldometer. Any errors or misrepresentations are my own.
These tables show all available US states and territories and the COVID-19 data for the last 5 days. I have sorted the states alphabetically and added growth rates for last several days for all states with ranking of each day. Of course, this information changes daily. I have presented the table in two parts because of the screen shot, but it is actually one table in Excel.
Again, results change daily.
For your information, the top 5 states or territories yesterday in growth rate (the worst containment) are: US Virgin Islands (0.571) with 66 cases, Minnesota (0.216) with 5136 cases, Kansas (0.158) with 4302 cases, and Oklahoma (0.154) with 3618 cases, Nebraska (0.135) with 4281 cases. US Virgin Islands growth rate is not of concern, because of their very low number of cases. Minnesota has been in top 5 list 9 of last 12 days. Kansas has been in top 5 list 3 of last 12 days. Oklahoma top 5 in 4 of 12 and Nebraska in top 5 in 8 of 12 days. The midwest in now the worst growth states.
A new column added on the left today shows the current growth rate divided by the 5 day moving average. No states yesterday over 2.00.
My calculated growth rate for USA is 0.0360 for yesterday, up from previous day of 0.0341. This is not population or case number weighted. The US growth rate average has the last three days.
We are in a critical time now as some states start to loosen restrictions. Continue to do your part to stay healthy and keep virus spread down.
Stay safe out there. Keep your family close and others at a distance.
volvolugnut
- Attachments
-
- State Growth 043020 B.JPG (209.14 KiB) Viewed 576 times
-
- State Growth 043020 A.JPG (243.92 KiB) Viewed 576 times
The Fleet:
Volvo: 2001 V70 T5, 1986 244DL, 1983 245DL, 1975 245DL, 1959 PV544, multiple Volvo parts cars.
Mercedes: 2001 E320, 1973 280, 1974 280C, 1989 300E, 1988 300TE, 1979 300TD, parts cars.
2009 Smart Passion
Ford: 1977 F350, 1964 F150 (2), 1938 Tudor Sedan
Farmall tractors: 1956 400 Diesel, 1946 A
And others.
Volvo: 2001 V70 T5, 1986 244DL, 1983 245DL, 1975 245DL, 1959 PV544, multiple Volvo parts cars.
Mercedes: 2001 E320, 1973 280, 1974 280C, 1989 300E, 1988 300TE, 1979 300TD, parts cars.
2009 Smart Passion
Ford: 1977 F350, 1964 F150 (2), 1938 Tudor Sedan
Farmall tractors: 1956 400 Diesel, 1946 A
And others.